The Practical Guide To AB testing statistics
An AB test helps you find out which version of a webpage is best. If your goal is to convert browsers into buyers, A/B testing will show you which page earns more sales. However, before you overhaul your website, it’s worth checking that your results are reliable. That’s why AB testing statistics are an essential part of website optimisation.
This Guide to AB Testing Statistics will show you…
- What AB testing statistics are – and why they matter
- How to create a hypothesis and test it
- When your experiments are statistically significant
The Practical Guide To AB Testing Statistics
- How Do AB Testing Statistics Work?
- What is “Significance” In AB Testing Statistics?
- AB Testing Statistics Glossary
- How Do AB Testing Statistics Work?
- Reducing Type 1 and 2 Errors in AB Test Statistics
- How Does Sample Size Affect Statistical Significance?
- Calculating The Statistical Significance of an AB Test
- Statistical Controversy: Frequentist VS Bayesian
- The Hybrid Approach to AB testing Statistics
- The No Peeking Rule For AB Testers
- The Practical Guide To AB Testing Statistics: Conclusions
It’s essential to the success of your AB tests that your data is understood properly. That means analysing the statistics to make sure your results are not due to chance. If you skip this step, there is a chance you could miss an important opportunity. Or, if you are not careful, you could make decisions based on a false positive.
When we perform an AB test (which is a form of “hypothesis testing”) we create two competing versions of a webpage and show them to two groups of randomly selected people. The new version (page B) will have different buttons, web forms, notifications or any other variation we can think of.
The different conversion rates we get for page A and page B show us which of our versions has performed better during the test. We then need to decide if the results are reliable and whether they tell us anything meaningful.
What is “Significance” in AB Testing Statistics?
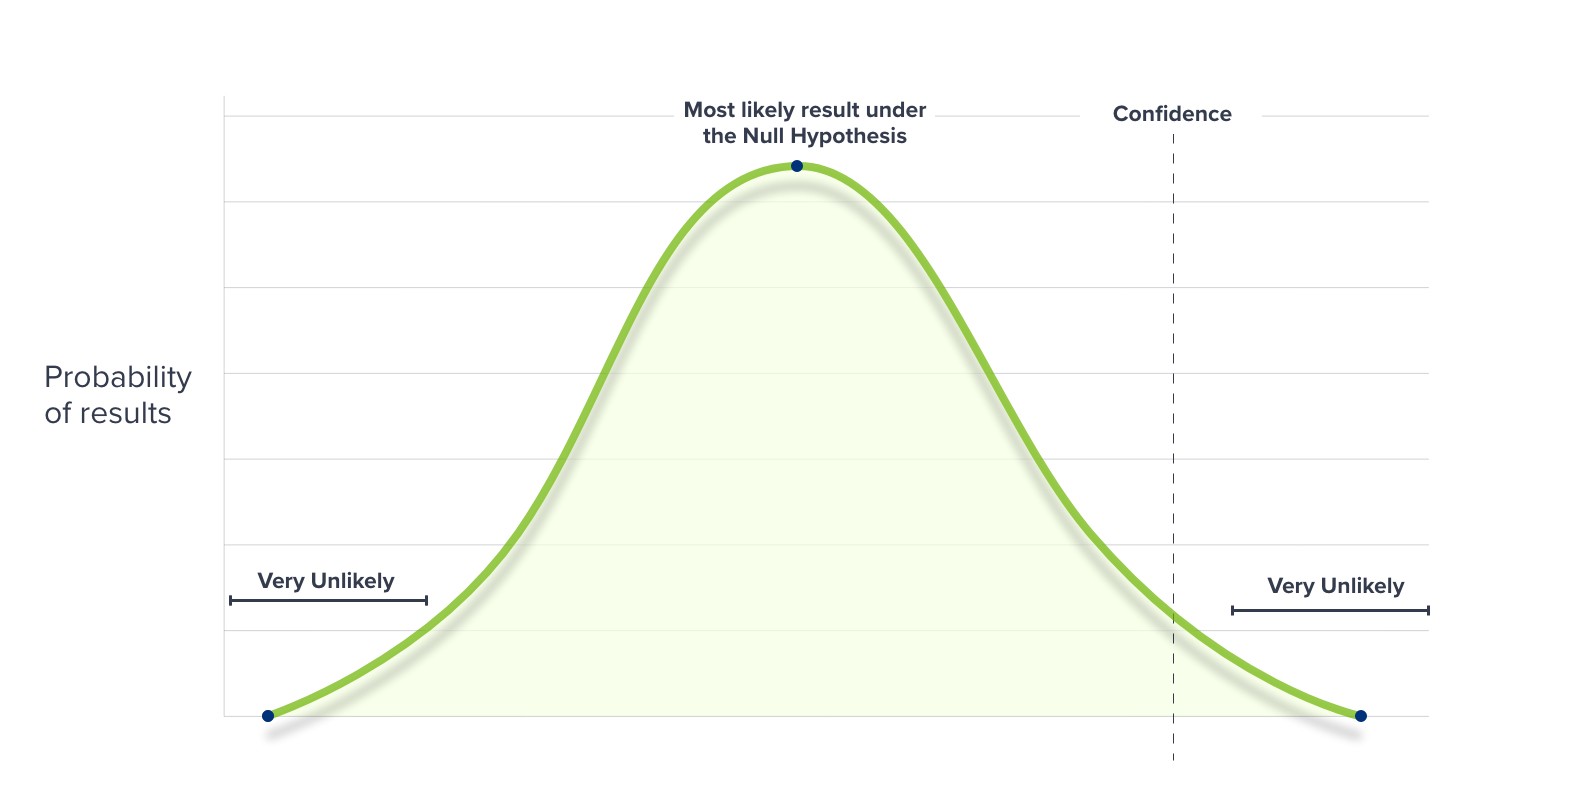
“Significance” is the most important concept in AB testing statistics. Results have statistical significance when they are very unlikely to have occurred due to random variations.
In other words, you are not likely to have produced the two different conversion rates for page A and page B unless something concrete has changed.
Why Does Statistical Significance Matter?
Even really positive results can be misleading. If your results are interpreted incorrectly, you run the risk of applying unproven changes to your website. You even run the risk of decreasing conversions. Statistical significance is a way of making sure that your results are reliable before jumping to any conclusions.
Marketers and CRO experts wait for a pre-determined level of Confidence before declaring a winning variation. Most of the time, this is set at 95%.
If your AB test results are statistically significant at a level of 95% they could still be due to random variation once in every 20 times. However, 95% of the time, your results will not be due to chance.
In an AB test, we use experimental data to evaluate two versions of our webpage. Unless the conversion rates of page A and page B are exactly the same, our test will produce a winner – but how do we know the winner is really better?
There are two possible explanations for the results — H1, the “Alternative Hypothesis”— and H0, the “Null Hypothesis.”
The Null Hypothesis states that there is no real effect behind the data your test has produced. You accept the Null Hypothesis when you do not have strong enough evidence to say that the new version of your webpage is definitely better than the original.
H1 is an alternative interpretation to H0. The Alternative Hypothesis is that you do have strong enough evidence to show that the new version of your webpage is better.
H0= the Null Hypothesis
H1= the Alternative Hypothesis
We want to test if H1 is true. However, in AB testing statistics, we do that by proving that H0 is NOT true. That’s why hypothesis testing is all about trying to reject the Null Hypothesis.
The Two Types Of AB Testing Statistics Errors
Because we are testing a specific idea (that our results show version B is better than version A), only two outcomes are possible when we are interpreting an AB test:
- We reject H0 and therefore accept H1 because the evidence is strong enough
- We cannot reject H0 because we do not have strong enough evidence.
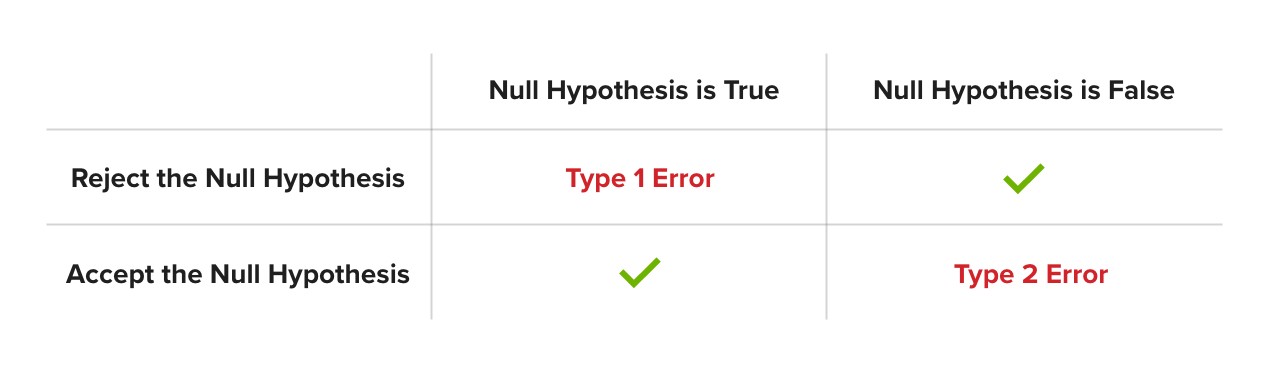
The rejection of H0 even when H0 is true is called a Type 1 Error.
This kind of error is also known as a false positive; we concluded that there was a significant effect, even though there was no real change.
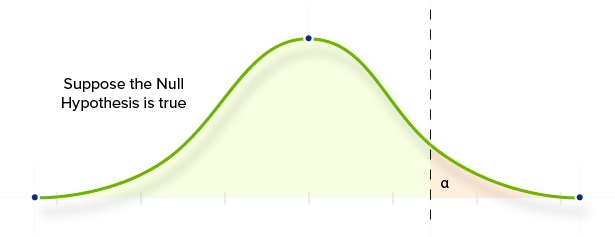
AB test results are considered “significant” if the probability of a Type 1 error is lower than our pre-determined “alpha” value (which is usually 5%). The Alpha value is the maximum chance of a Type 1 error that we will accept. It is 100% minus our Confidence Level (which is usually 95%).
A Type 1 Error is the error that we most want to avoid because it is more important to not commit a Type 1 Error than it is to avoid a false negative (also known as a Type 2 Error). This is because committing a Type 1 Error could end up reducing your conversion rate.
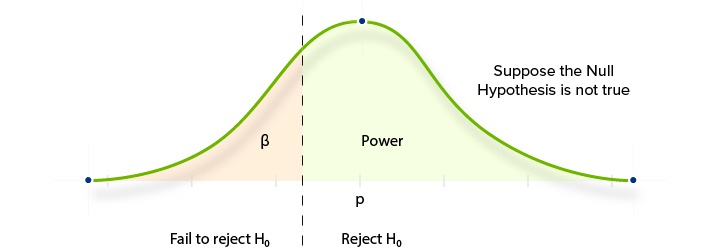
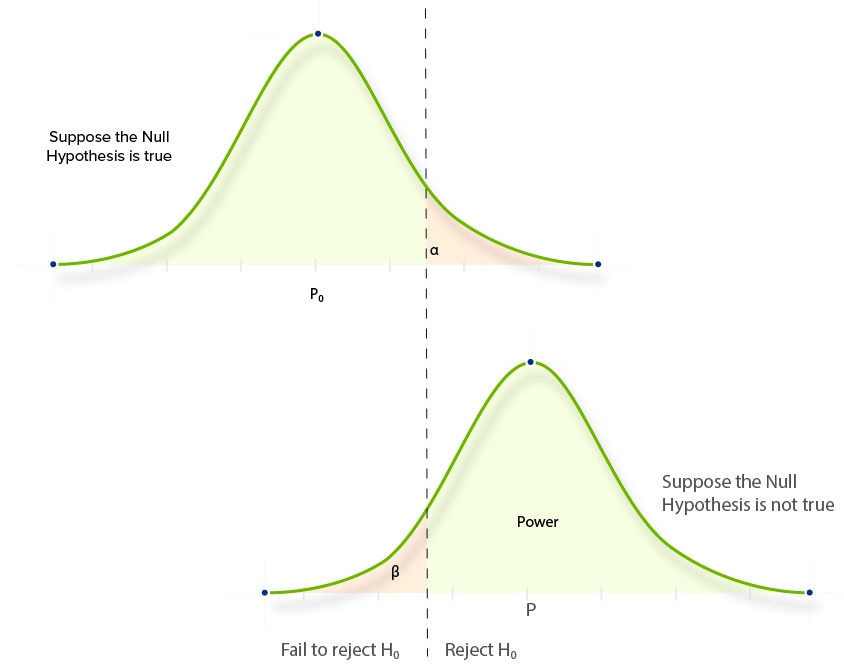
The acceptance of H0 when H0 is false is a Type 2 error. The probability of committing this error is our “beta” value. The probability of NOT committing this error is called the “Power.”
This chart shows how the two kinds of statistical errors work in AB testing.
- The left curve shows the probable distribution of observed conversion rates of page B when there is no significant difference to the original “A” version. If we ran the test hundreds of times, we would expect to observe the same conversion rate as page A (in blue) most frequently. In other words, this curve is what we would expect to see given the Null Hypothesis (H0).
- The right curve (H1) shows the probable distribution of observed conversion rates of page B given the Alternative Hypothesis. In this second curve, the Uplift is quite significant. So, after running hundreds of separate tests, we would expect to observe a large number of significantly higher conversion rates than page A.
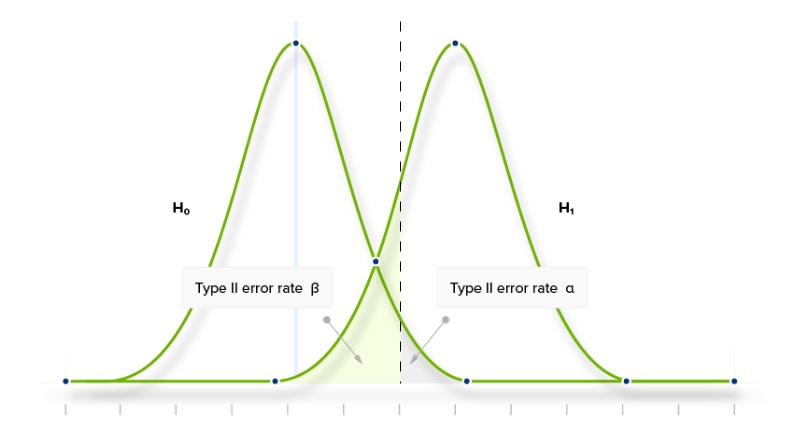
The dashed line is where our Confidence Level intersects with the observed conversion rate (given a large enough sample). Where we set our Confidence Level has a big impact on the probability of committing a Type 1 or Type 2 error.
It is important to notice that these two errors are antagonistic. Trying to reduce Type 1 Errors by increasing the Confidence Level will increase our chance of committing Type 2 Errors. Testing with a statistical significance level of 95% will produce more false positives (Type 1 errors) and fewer false negatives (Type 2 errors) than testing with a significance level of 99%.
In other words, we cannot try to reduce both Type 1 and Type 2 errors simply by adjusting our testing strategy.
Your A/B testing sample size is simply the number of people who have visited the two webpage variations. To calculate the sample size you will need in order to achieve statistically significant results, you need to know three things:
- The Power of your test
- Your confidence level
- The size of your uplift
In general, the larger the sample size, the more accurate the test will be.

The real danger with small data sets is that “outliers” — groups of people who behave quite differently to the population as a whole – are more likely.
Reducing Statistical Errors By Increasing Our Sample Size
Whilst we can’t reduce both Type 1 and Type 2 errors simply by adjusting our testing strategy, we can reduce the probability of committing either of the two errors by increasing our sample size. For AB testing, this is the number of visitors to pages A and B.
By running an AB test for longer, you can reduce the occurrence of both types of statistical error. This is because increasing your sample size almost always makes your data more representative of reality. You can see this by comparing how different sample sizes affect the areas either side of our confidence level.
There will still be some instances in which Type 1 and 2 errors are made, but they will be proportionally fewer because the curve is steeper.
Your test will be statistically significant when your p-level is lower than your alpha value. This means the following things have probably occurred:
- You have collected a large enough sample
- An uplift is clear from your data
- The power of your experiment is sufficient
An A/B testing tool will usually calculate the significance of your test automatically. However, you can also put your data into a significance calculator like this.
At this point, it is worth giving some definitions for the technical terms that occur when we are discussing AB testing statistics.
(Compare to Beta “B” and Confidence)
The Alpha value is the maximum limit you allow for the probability that your results are due to chance. For example, with an Alpha value of 0.03 (or 3%) you know that your results would be due to chance in fewer than 3% of cases. An alpha value of 0.05 is conventional within AB testing statistics.
(Compare to the Null Hypothesis)
The alternative hypothesis is the idea that your test has produced a clear effect (usually, this means there has been an uplift in the conversion rate of your webpage). The alternative hypothesis is sometimes written “H1”.
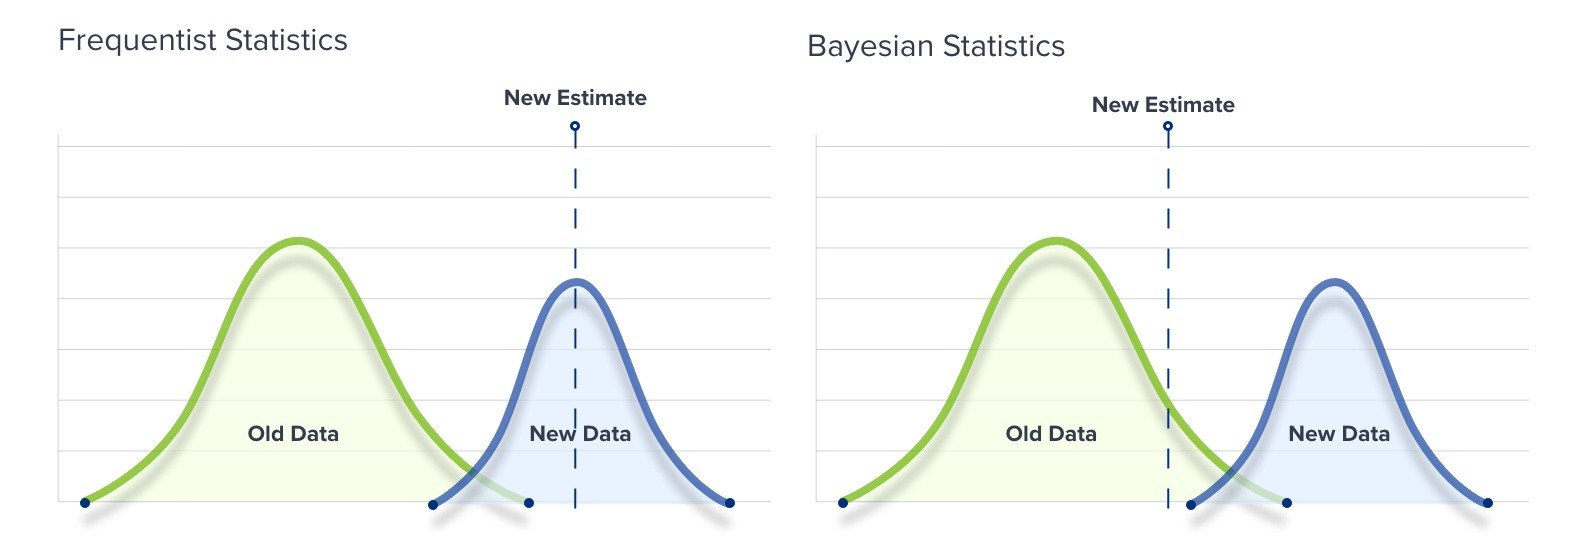
(Compare to Frequentist Statistics)
Bayesian statistics work by adjusting an estimate (the Prior Probability) with each new set of test results. The resulting estimate (or, “Posterior Probability”) is usually more reliable than the previous one, and will continue to become more reliable with every test.
Rev. Thomas Bayes (1701-1761)
Bayesian probability—coined in the 18th century by Presbyterian minister Thomas Bayes—is believed to have been developed to counter David Hume’s argument that a seemingly “miraculous” event was unlikely to be a true miracle. Hume argued that the rarity of a miracle made a non-miraculous explanation more likely (similar to our Null Hypothesis).
Bayes challenged Hume by showing that future outcomes can be mathematically predicted by past occurrences. The perceived rarity of an outcome, miraculous or not, is less reliable than the Bayesian “Posterior Probability”.
As a 2014 New York Times article reported, even Hume might have been “impressed” when Bayesian statistics were used to find and rescue a lost fisherman in the Atlantic Ocean.
(Compare to Alpha “a” and Confidence)
The Beta value is the probability of a false negative. The probability of identifying an effect when one exists (see “Power”) can therefore be formulated as: 100%-b
(Compare to Alpha “a”)
If the Alpha value is the maximum limit you allow for the probability that your results are due to chance, the Confidence Level you choose is the minimum probability that your results are not due to chance. If you set your Confidence Level at 95% then 19 times out of 20 your results will reflect a real change.
(Compare to Bayesian Statistics)
Unlike Bayesian Statistics, Frequentist Statistics only consider the number of times something occurs within a sample. The larger the sample is, the more accurate the statistics are.
(Compare to the Alternative Hypothesis)
The Null Hypothesis states that your results can’t prove an effect has taken place. It does not mean that no effect exists, nor that an un-proven effect is necessarily unsubstantial.
(Compare to Two-Sided Hypothesis)
If you are only interested in proving or disproving an uplift one direction (for example, if you only care if version B of a webpage converts more than version A) then your test is One-Sided. One-Sided tests usually require a smaller sample size, but they could lead you to ignore a significant negative uplift.
P-value
Your P-value is the probability of observing results as extreme as yours if the Null Hypothesis was correct. Therefore, if your P-value is smaller than your Alpha value (the maximum probability you are willing to accept), your results can be considered significant.
Power
The ability of an AB test to detect an effect is known as its Power. It is measured on a scale from 0 to 1. If experiment X has a statistical power of 0.7, and experiment Y has a statistical power of 0.95, then there is a stronger probability that experiment X would produce a type II error than experiment Y. Similarly, Y is more reliable than X because it reduces the probability of a type II error.
Regression To The Mean
When your sample data is particularly extreme, it is likely that following samples will be less extreme. This is NOT because an extreme result has any effect on subsequent results, it is because extreme results are less likely than “normal” ones.
Being “Mean” To Fighter Pilots
Daniel Kahneman, author of “Thinking Fast, and Slow”, experienced an interesting example of Regression To The Mean. Whilst lecturing to a group of Israeli fighter pilots he suggested that positive reinforcement was more effective than negative feedback. This enraged the flying instructor who was used to giving harsh feedback following any poorly performed aerial manoeuvres. The instructor insisted that negative feedback improved subsequent manoeuvres, because it encouraged his pilots to fly better.
In reality, the instructor was falling victim to the Regression to the Mean. Following an unusually poor performance, his pilots were always more likely to improve than they were after a good performance.
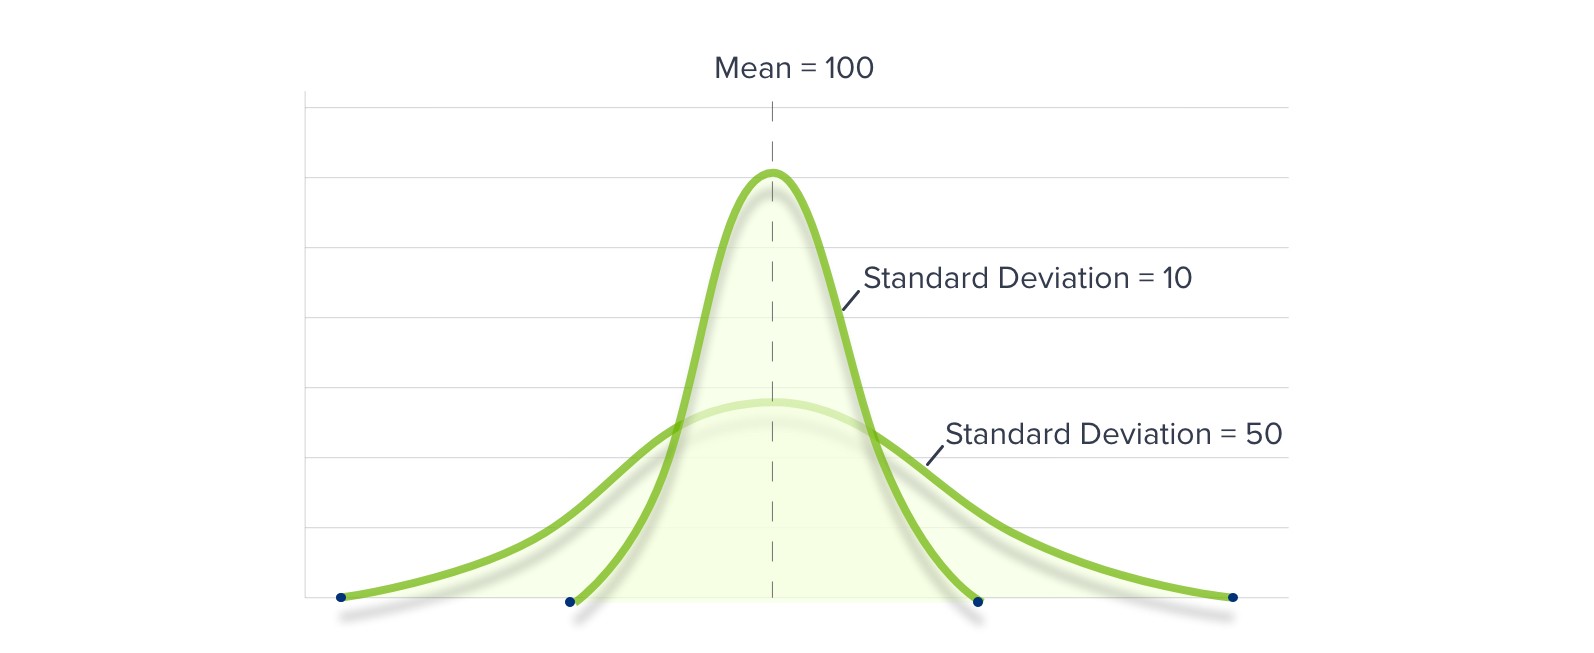
Standard Deviation
The square root of your sample data’s “Variance”. Standard Deviation is a mathematical formula used to calculate the spread of your data around the Mean.
Statistical Significance
When your results are very unlikely to have occurred if the Null Hypothesis was correct. An AB test’s significance is the most important aspect of AB testing statistics.
(Compare to One-Sided Hypothesis)
An effect in one of two directions that you expect to see in your results. In AB testing, it means that B is either significantly better or significantly worse than A.
Type 1 Error
Rejecting the Null Hypothesis even though it is true (declaring an effect even though it doesn’t exist). Your P-value is also the probability of committing a Type 1 error. The level of Statistical Significance you choose (90%, 95% or 99%) is the probability that “significant” results are not a Type 1 error.
Type 2 Error
Accepting the Null Hypothesis even though it is false (not declaring a real effect). Statistical Power reduces the chance of committing a Type 2 error.
Uplift
Uplift is the percentage increase in conversion rate between your two web pages. A common mistake within AB testing is to confuse the Uplift percentage with the percentage increase in sales.

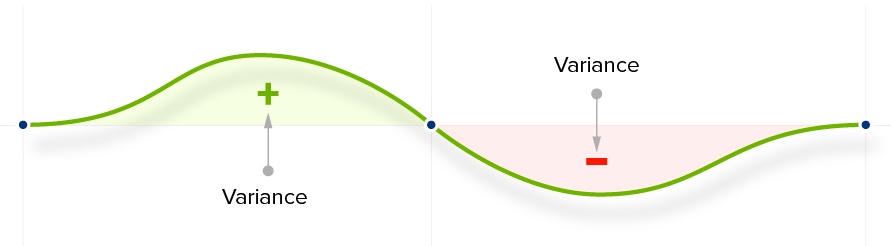
Variance
The square of your Standard Deviation. It measures the spread of your data either side of your mean.
Even though ab testing statistics might seem objective, there are actually a number of opinions about the best way to interpret them. The debate comes down to different ways of thinking about probability.
The Frequentist Approach
The Frequentist approach to statistics and probability is based on the frequency of something within a sample. Only the data collected from an experiment is used.
If you want to see which webpage—A or B—performs best over the course of a particular Monday, you take the data from the course of the day and calculate the uplift produced by page B. You then calculate the statistical significance to determine whether or now page B did indeed perform better than page A.
The Bayesian Approach
The Bayesian approach applies an experiment’s data to a “Prior” number. The results from the current experiment are compared to previous data to draw conclusions.
Applying this approach to the conversion rates of pages A and B on Monday would mean comparing Monday’s results to those of the previous ten Mondays, and modifying your expectations accordingly.
How can I choose which approach is right for me?
There are pros and cons to both approaches. The Frequentist, or “classical” approach, is less complex and often faster. It uses straightforward calculations and a fixed data set that is only related to the specific experiment at hand. However, it does leave more chance for the results to be merely due to chance.
The Bayesian approach is more complex, but potentially more reliable.
Because AB testing is online and automatic, we can use much larger sample sizes than were previously possible. That increases the representativeness of our tests and makes frequentist statistics more reliable.
However, the fact that AB testing statistics can be left to a computer reduces the burden on the experimenter. If the Bayesian approach can give us a more accurate interpretation of our results, it makes sense to incorporate it.
The best approach is, therefore, to use the best of both. At Convertize, we use a Hybrid Approach to ab testing statistics. Our software combines both approaches automatically, so you get faster, more reliable results.
The desire for quick results can lead marketers to check their AB test’s significance at the end of each day, hoping to complete the test early. Statisticians often suggest a “no peeking” rule, since marketers might be tempted to end an experiment the moment significance is found, but before a large enough sample size has been reached.
An extreme result produced by a small sample is more likely to be due to chance than to indicate a significant effect. Extreme differences between one scenario and another are unusual, but extreme results can easily occur due to a sampling error (such as having sample that is too small, and therefore unrepresentative of the chosen population). When this occurs, Regression to the Mean often takes place.
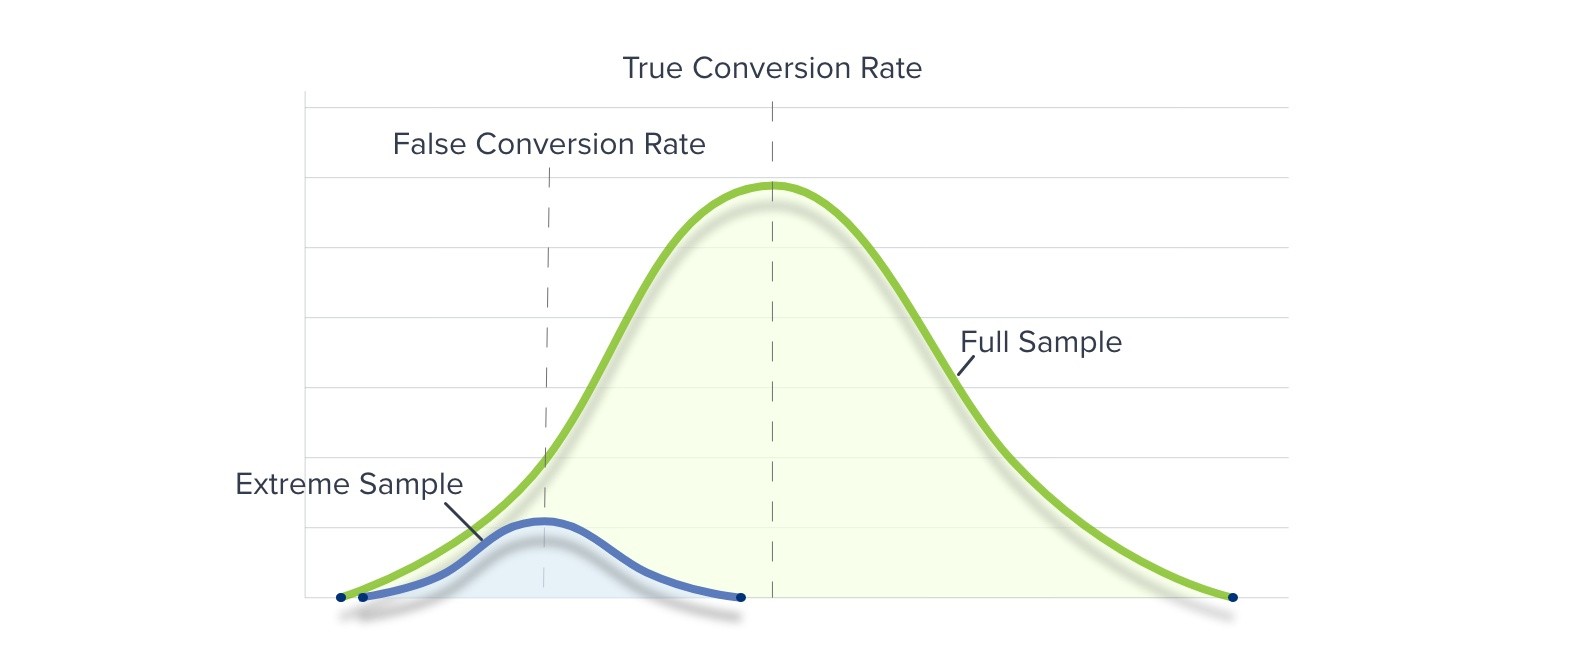
“No-Peeking” And Regression To The Mean
If you peek at your AB test’s results before a large enough sample size has been reached, and the results are unrepresentative of the true population, you could easily produce unrepresentative results. Subsequent tests would expand your sample and produce more realistic data (gathered more closely around your Mean).
To avoid sampling errors, you should not consider your results until a substantial sample has been collected. For example, our software only provides AB testing statistics after a set number of running days. After this “warm up” period, the software calculates Uplift and Significance on an hour-by-hour basis.
It’s tempting to imagine that websites with huge traffic can AB test at will. But that’s not true.
For high-traffic websites, even the slightest change can win or lose many thousands (or millions) of dollars. Making even a small error is hugely costly, so the requirements for statistical significance are much higher – and that makes testing more difficult.
With lower volume, you need to create a big uplift to achieve statistically significant results. But, if you believe you are heading in the right direction, you can accept higher risks within your testing strategy.
Quick Tips
There are one or two “best-practice” guidelines that you should always follow, regardless of your sample size and strategy:
- Run sequential tests and don’t test for less than a week (because Sunday’s sales are unlikely to match Monday’s)
- Don’t respond to your results before they are significant
- Bookmark this page and return to it as often as you need
- Never stop a test to change the parameters as this will corrupt your data
Next Steps
To read more about the Hybrid Approach to AB testing statistics, download this e-book.
Or, if you have a website to run tests on, download Convertize and use your free trial to set up a test.
by Jochen Grünbeck
Jochen is co-author of "Smart Persuasion - How Elite Marketers Influence Consumers (and Persuade Them to Take Action)". After an MBA at INSEAD, he began his career at Airbus. Then, he moved on into Management Consulting, focusing on purchasing and negotiation strategy as well as cost optimisation projects for bluechip and midsize companies in France and Germany. His experiences led him to specialise in persuasion psychology, behavioural economics and conversion rate optimisation.