AB Testing Sample Size: The 4 Levels of Difficulty (2025)
We get lots of different questions from people who are interested in A/B testing, but there’s one question we hear more than any other: “Can I do A/B testing with under 100,000 visitors a month?” A surprising number of optimisation projects end up being useless and AB testing sample size is often the reason. This article will show you…
- How to calculate your AB testing sample size
- Whether or not AB testing is a useful tool for your website
- Things you should always do and things you should never do when AB testing

The AB Testing Sample Size Guide
- What is AB Testing?
- How To Calculate Your AB Testing Sample Size
- How Long Is Too Long To Run A Test?
- A/B Testing Sample Size: The 4 Levels of Difficulty
1. Fear Factor zone
2. Thrilling zone
3. Exciting zone
4. Safe zone
The goal of A/B testing is to create Uplift – an increase in your conversion rate. Finding a way to do that is not easy, and achieving statistical significance is downright difficult. That’s why you need to think about your AB testing sample size BEFORE you launch an experiment.
To give you a sense of the sample size needed to run AB tests on your website, we have created a chart showing how many visitors your website will need in order to produce significant test results. Before that though, we should recap some fundamental principles. For example, what is AB testing?
What is AB Testing?
AB testing is a type of experiment that compares two versions of the same webpage: A and B. Your visitors are split into two groups, each being shown one version. The aim is to see which version of the webpage has the best conversion rate.
To make sure your conclusions are reliable, you need to ensure that your experiments are statistically significant. Unreliable data could lead you to waste your marketing budget on a false positive.
What does it mean if an A/B test is significant?
Statistical significance means your results would be unlikely to occur if there was no real effect taking place. For an A/B test, it usually means that a real change has taken place on your webpage. To calculate your A/B test significance you need to know three things:
- Your Sample Size
- What level of Confidence you want to achieve
- The size of your Uplift
Entering this information into a significance calculator will tell you if the results for a test you have already run are significant.
To calculate the sample size you need to complete a new test, you use the same kind of information, but arranged in a different way…
How to Calculate Your AB Testing Sample Size
Working out how many visitors will be required for a test you plan to run in the future is more complicated than calculating a previous test’s significance. To work out the AB testing sample size you need, you can use a sample size calculator.
You will also need to provide 3 kinds of information….
1. The Conversion Rate For The Page You Want To Test
To calculate the Conversion Rate of the page you want to test, you simply divide the number of sales or sign-ups it has produces by the number of visitors it receives.
2. The “Uplift” You Expect To Achieve
Next, you need to predict the increase you expect to see in your conversion rate. This is quite tricky. Remember, it’s not the uplift you want – it’s the uplift you can reasonably expect your changes to produce. There are some general guidelines that can help you estimate this number:
- Conversion Rate Optimisation experts agree it is very difficult to get an uplift of more than 10% on a single webpage
- Achieving uplift beyond 10% requires “innovative” changes to your site or your business (for example, lowering your prices, changing you offers, rebranding or restructuring your website.)
- Less dramatic “iterative” changes (such as adjusting a button colour, headline or image) generally produce an increase of less than 7%. It is possible that this kind of change would produce no change or, even, a negative uplift.
- Therefore, in most cases, we would recommend 5% as a realistic projected increase.
3. Some AB Testing Settings
These are the settings you should enter into a significance calculator, if it gives you the option.
- Hypothesis: “Two-Sided”
A two-sided hypothesis means you are testing if version B is different to A – either better or worse. It is different to a one-sided hypothesis, which would only test if B is better than A.
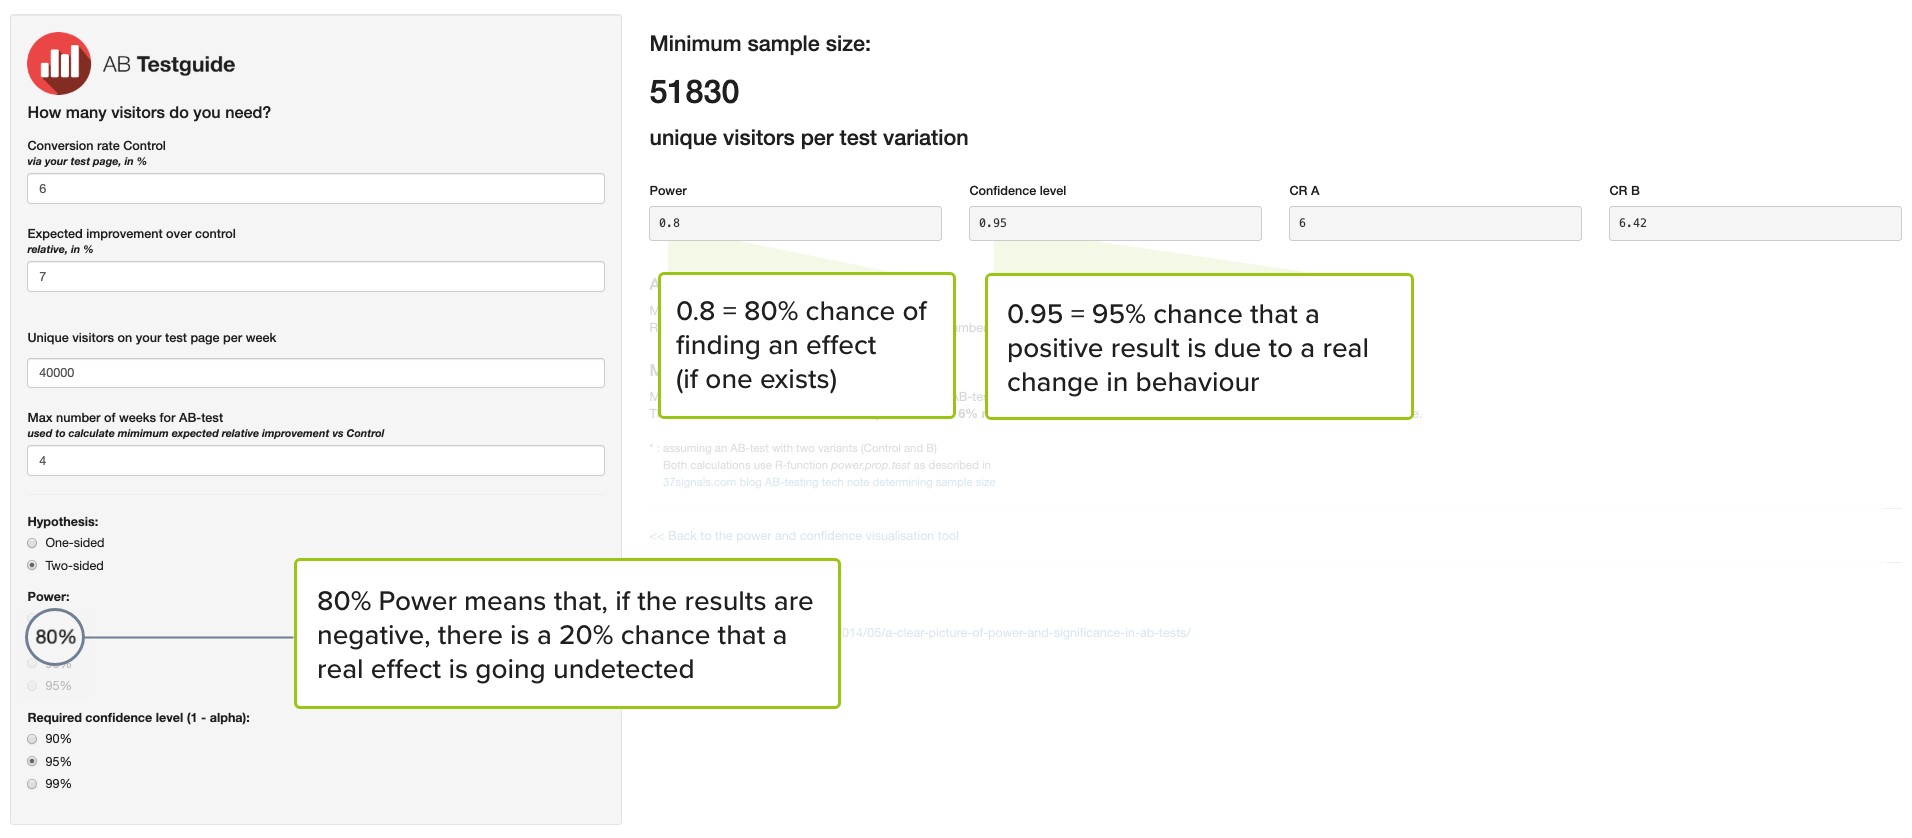
- Power: 80-90%
Statistical “Power” is the probability (written as a percentage) that you will find a change in conversion rate if one exists. You can also think about it as the inverse of the probability of committing a Type 2 error. It depends on your sample size and the type of results you get. The higher you want your statistical Power to be, the larger your sample size will need to be
- Confidence: 95%
This is the probability that a change observed in your data represents a real effect and not a Type 1 error (observing an effect when no real effect exists). It is usual to accept a Confidence level of around 95%. That means your alpha number (the chance of seeing an effect when one doesn’t exist) is 0.05 (or 5%).
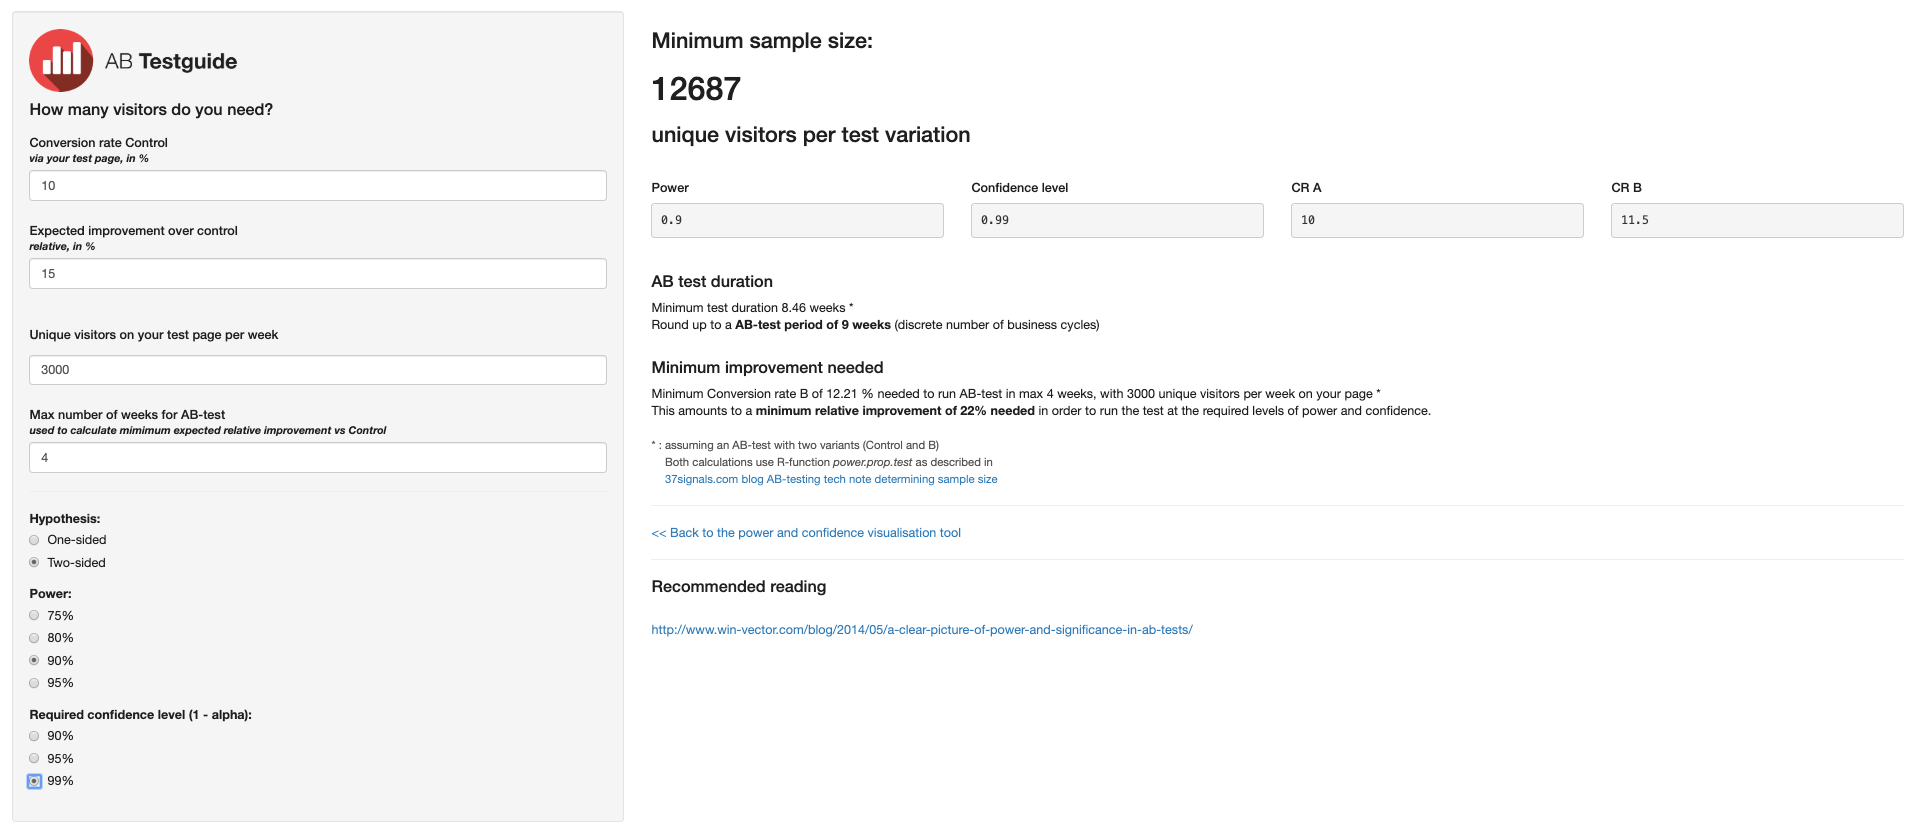
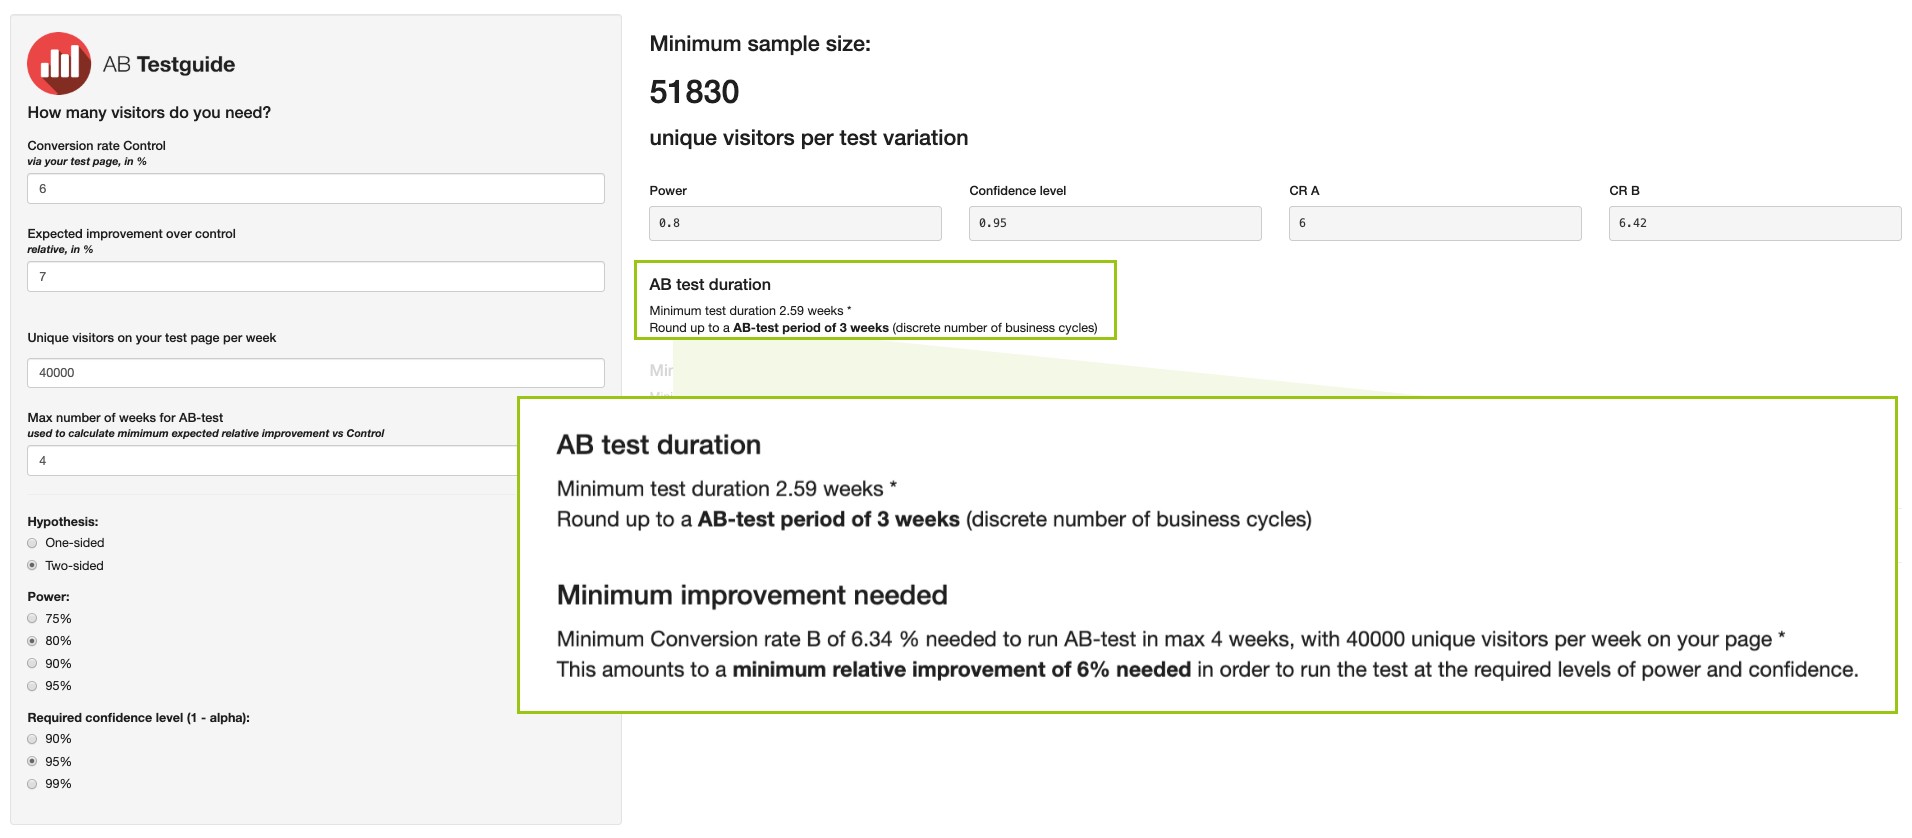
Your AB Testing Sample Size
By entering these kinds of information into an AB test sample size calculator, you can find the minimum sample size required for your experiment. This is often given in terms of “unique visitors per test variation”.
So, if the page you want to test has 40,000 weekly visitors and you need a sample size of 51,830 visitors per variation (103,660 in total), you will have to run the test for three weeks (rounding up).
With these settings, the experiment will have the following error margins:
- (If the Alternative Hypothesis is confirmed) a 5% chance of a false positive (also called a “type 1 error” or a)
- (If the Null Hypothesis is confirmed) a 20% chance of a false negative (also called a “type 2 error” or ß)
How Long Is Too Long To Run A Test?
Maximum Test Duration
In general, it’s best not to set a test to run any longer than 30 days and 60 days is probably the maximum.
Running a test for more than 3 months is risky because many of the conditions will have changed over such a long period. For example, 10% of internet users erase their cookies once a month, on average. Most tools use these cookies to keep each visitor on one version of your webpage so they need to remain in place throughout the test.
Minimum Test Duration
Your AB test sample needs to be both large enough and representative. If you run a test for less than a week your results could be biased by day-by-day variations. This problem is more significant for tools that use a multi-armed bandit to shift traffic between your pages. Running a test on continuous days also has the potential to include anomalous behaviour (like when people buy more on Black Friday).
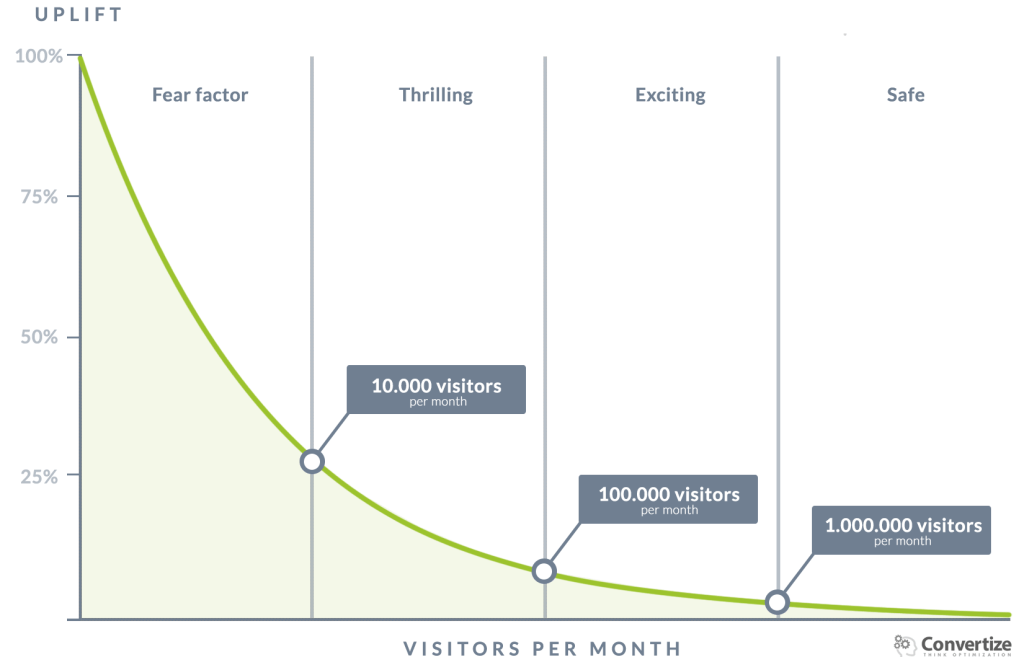
AB testing sample size: The 4 levels of difficulty
The graph below can help you to see how difficult it would be to get reliable test results with a particular AB testing sample size. Rather than calculating your sample, this chart shows you the minimum effect (an increase in your conversion rate) that you would need in order to be confident that the results were reliable. In other words, this graph can help to show you if AB testing is a good option for your website.
Industry Averages: Benchmarks
This graph is based on conditions that reflect the industry average for eCommerce sites:
- Site conversion rate is 2%
- Test duration is 30 days (you should NOT test longer: cookie deletion will make your results unreliable)
- 1 control page (A) and 1 variation for testing (B)
- Confidence level: 95%
- Power: 80%
Websites can be split into 4 groups based on their monthly traffic. For each group, you can see the increase in conversion rate that would be required for an accurate result.
What Are The 4 difficulty levels?
A word of caution first!
These traffic numbers relate to the traffic going through a specific conversion funnel of your website (NOT your entire website traffic):
If you conduct an AB test on a specific landing page with a conversion goal, it is the traffic entering the funnel through this landing page that is relevant.
For example if your monthly traffic is 100 000 visitors, but only 30 000 go through this specific landing page, the traffic number to use to evaluate your statistical significance is 30 000, and NOT 100 000.
1. Fear Factor zone
With less than 10,000 visitors a month, AB testing will be very unreliable because it’s necessary to improve the conversion rate by more than 30% in order to have a “winning” variation.
2. Thrilling zone
With between 10,000 and 100,000 visitors a month, AB testing can be a real challenge, as an improvement in conversion rate of at least 9% is needed to be reliable.
3. Exciting zone
With between 100,000 and 1,000,000 visitors a month, we’re entering the “Exciting” zone. It’s necessary to improve the conversion rate by between 2% and 9%, depending on the number of people who visit the actual page you are testing.
4. Safe zone
Beyond one million visitors a month, we’re in the “Safe” zone, which allows us to carry out a number of iterative tests.
AB Testing Sample Size: What to Do If You Can’t Enough Traffic
It is always worthwhile trying to test your assumptions. So, even if your traffic is too low to provide a reasonable AB test sample size, you should still gather data about your visitors’ behaviour.
Here are three things you should do:
- Try to increase your traffic!
- Work on optimising your whole website:
- solidify your USPs: why visitors should buy from you rather than your competitors
- audit your technical performance: does your site work well on all browsers, devices, etc
- Consider qualitative tests:
- gain a better understanding of who your visitors are (with mini-surveys, customer analysis…)
- see how people behave when they visit your site (with heat maps, user testing…)
Even if you do have enough traffic to to AB testing (for example, if your website is in the 10,000 to 100,000 visitors a month zone) it is still quite difficult to know what to test. Because of this, qualitative tests can be valuable for any website. By understanding your visitors better, you can target your experiments more effectively.
Beware of micro conversions!
Micro conversions are steps that occur during your conversion funnel, for example when someone adds a product to their basket. The final sale is the “true” conversion – the one that affects your revenue.
It’s quite easy to increase the rate of micro conversions and so it can be tempting to try and base your tests on these. However, you must always also measure the impact the test is having on “true” conversions. Otherwise, you could end up compromising your overall revenue.
If you optimise “too much” on one side, then it could result in a decrease in conversion on the other side. For example, if you over-optimise one page through the use of motivating messages but then the promised incentive isn’t realised on the following pages, your overall conversion rate is likely to drop. This is called the Roberval Balance.
AB Testing Sample Size: Conclusions
AB testing is an important technique for validating ideas. When used alongside a coherent statistical method it can provide robust information about how to optimise a website.
However, to run tests successfully, your sample size must be sufficient.
Subscribing to an expensive AB testing tool doesn’t guarantee results, either. Often, the most popular tools are the ones that mislead their users into performing poorly-designed or invalid tests. The objective of these companies is to sell you a 12-month subscription and to make it feel like the software is making a big difference. The best way to avoid being misled is to gain a thorough understanding of AB testing and statistical hypothesis testing – that way you can make informed choices.
by Philippe Aimé
Philippe is the CEO of Convertize. He created his first website in 1998 and has spent the past 20 years finding ways to make digital marketing more persuasive. He now heads a team of CRO consultants.


Google’s 41 shades of blue is a good example of this. In 2009, when Google could not decide which shades of blue would generate the most clicks on their search results page, they decided to test 41 shades. At a 95% confidence level, the chance of getting a false positive was 88%. If they had tested 10 shades, the chance of getting a false positive would have been 40%, 9% with 3 shades, and down to 5% with 2 shades.
That’s a great example. It’s not easy to do AB tests well – but testing resources is one reason why platforms like Google develop such a strong monopoly!
Wouldn’t they have had to use a different statistical test to avoid this false positive bias? For example an ANOVA?
ANOVA (Analysis of Variance) would certainly have helped to explain any effect observed in the results. It’s easy to imagine that Google would have incorporated some additional variables (time, location…) to make sense of their data…
Muchas gracias. ?Como puedo iniciar sesion?